
What is Regression?
In simple word it’s a relationship!! exactly what we have in facebook but here it is not between two human beings between two set of numbers.
Examples: Sales ~ price
what will happen to sales if price increase/decrease. If price goes up sales goes down kind of relationship most of us know. We know it from our past experience. But if i will tell you neurofibromin ~ helix-loop-helix(HLH) what will happen if i increase HLH what will going to happen with neurofibromin. (This is what most of us don’t know from our past experience).Regression will tell us what is the relation ship between sales ~ price or neurofibromin ~ helix-loop-helix(HLH) if one increases what happen to others that is the relationship what we can find out.
Don’t you think that more beneficial will be how much increase or how much decrease if you want to quantify that how much. This is the essence of regression.
Regression will tell you two thing if there is a relationship what is that if i increase 1 other increases then it is a positive relation ship. If i increase 1 other decreases then it is a negative relationship. Other thing is it quantifies, if i increase the price by one unit what is the sale i will going to loose.
Example with Quantification: 2.5 * Sales ~ Price * 1 (if i multiply price by one sales will be reduced by 2.5) or Sales ~ -2.5 * Price. 2.5 is called as coefficient.
Sales ~ -2.5 Price + 15 Festival if you increase the price some time sales will increase during festival time. So sales is not only depends on price or only on festivals these are different on multiple factors. Sales can be influence by your own price, competitor price, session, promotion. Regression Analysis will help you to under stand if you 20 unit of your sales gone up then how much amount additional unit up due to only price, because 20 unit is a combined effect both price and festival.
Sales = price_own + price_comp + prom1 + prom2 + promn + … seasonality + error
Some time while predicting we many overestimate or underestimate, error is the difference between prediction and observed value.
Dummy Variable: if there is some categorical variable like sex(m/f) if i want to know effect of male over female. (It is a artificial Variable)
Case Study:
1. Log into Microsoft Azure account
2. Go to new -> Intelligence+Analytics -> Machine Learning Web Service

3. Hit Machine Learning Studio( used to create experiments, Models, to do evaluations)

4. Following is the ML Studio.

5. To upload a Data set hit New from Bottom Left corner. Go to data set and upload a file from local and say Ok.

6. To do experiment hit New from Bottom Left corner. Go to Experiment and hit Blank Experiment

7. Give some Name to Experiment, Drag and Drop Dataset to Canvas.

8. Hit on the pointed circle on the dataset and hit visualize to understand the data.

9. If you observe statistics it is showing up unique values and missing values and Feature type too

10. Before going to create a model have to cleanse the data set
11. To cleanse missing values go to Data Transformation and drag and drop clean missing data to canvas connect to dataset

12. Click on Clean missing data and go to properties right side and set cleaning mode to ‘Remove Entire Row’ and then right click on Clean missing data and hit Run selected.

13. After cleaning the missing value if you check the dataset no. Of rows is decreased and also no missing values

14. If you observe the dataset well for Country and state have single value which we can neglect & we can get rid off columns Education Loan and Auto Loan as well
15. Go to Data Transformation -> Manipulation , drag and drop ‘Select Columns in Dataset’ and hit Launch column Selector from right properties.

16. Under ‘With Rules’ Category and hit All Columns and Exclude the columns which we don’t want as below and say Ok

17. Right click on ‘Select Columns in Dataset’ and hit Run Selected. Now visualize the Data, columns also came down and this is the fiend dataset for machine Learning


Linear Regression Model – Train, Score& Evaluate Model
18. Now will do Linear Regression Machine Learning Algorithm. For this we need
· Trained Dataset and
· Test dataset to Score&Evaluate the model we have trained dataset and see if the model is good or not
19. As we have single dataset in the current scenario will split that in order to perform training and testing. So, go to Data Transformation -> Sample&Split drag and drop Split Data to canvas and link from previous step.
20. While splitting make sure that more percentage for training part than Test data. Because the more we train data the better the dataset is.
21. So, Right click on Split Data, go to Properties, set Fraction of data to 0.8 (which means 80% of data would go to port one of split data and that will be used of training) and Run selected

22. Now if you visualize Results of port1 from Split Data it is showing 230 records out 287 under training and from port2 57 records under test dataset as follows


23. Now go to Machine Learning -> Initialize Model drag and drop Linear Regression to canvas and then drag Train model from Machine Learning -> Train to canvas
24. Link Linear Regression to first input port of Train Model and Train dataset from Split Data to Second input of Train model as follows and hit Launch Column Selector to choose target Column.

25. Our target is to predict : what would be the average monthly spend of Customer based on Demo Graphics.
26. So, Select Monthly spend as target column and hit Run selected


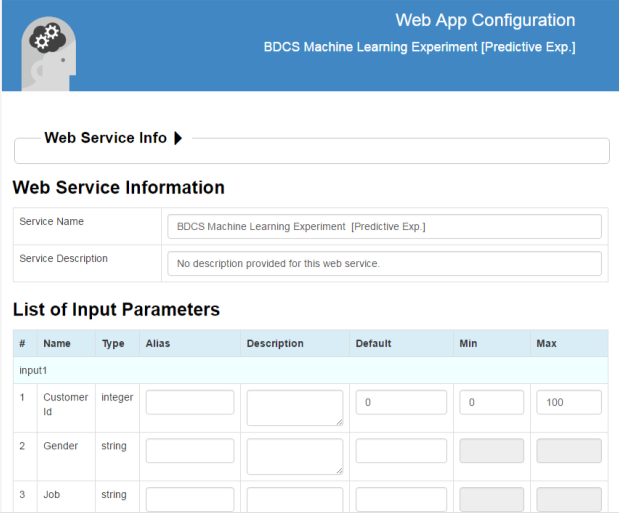
27. Once the model is Run , model is trained. Now have t score the trained model.
28. Go to Machine Learning -> Score, drag and Drop Score Model to canvas and Link from Linear Regression to first port and Test result of Split Data to second port as follows and Right click , hit Run Selected

29. To Understand the score of the model right click on Score Model and hit visualize as follows

30. For test Data we got scored Labels. When we match monthly spend and Scored Labels few are closer unlike others.

31. Let’s go ahead do evaluation on model. Drag and Drop Evaluate Model from Machine Learning -> Evaluate to find how good or bad the model is ? And link from Score Model, right click and hit Run Selected

32. Visualize the dataset, it will show up metrics a follows


33. Mean Absolute error is the difference between Actual Monthly Spend values and Scored Labels of trained dataset. +/- 105 is not bad error.
34. Up to now following is our model

Deploying Linear Regression Model as Web Service
35. Now will set up Web Storage for the above Model
36. Go to Set up Web Service -> Predictive Web Service

37. We can see few changes happened in the canvas and hit run from bottom of canvas

38. And make sure it is running without any errors. Once Run finished hit Deploy Web Service fron bottom of Canvas

39. Hit Test as shown Below. Provide some test Data


40. Test has completed successfully

41. Go to Configuration and have look what is the name and input schema given to web service

42. Hit the New Web services Experience Link

43. Go to Consume and hit Request-Response web app, it will take you to Azure Web Portal

44. Hit Get it now and say continue to login with Azure account

45. Give app name, select existing resource name, check pin to dashboard and hit Create.

46. Open the URL of Web service

47. It will ask to provide request-response key and API key
48. Get Request-Response Key from following page

49. Get API key from following page and hit submit

50. It will forward you bdcsML web app as follows
51. Following are the input parameters to provide

52. If we provide sample data then it will come up with Average Monthly spend as Result as follows.


